Uncover Hidden Trading
Opportunities With ChartEye Ai
What is ChartEye AI?
ChartEye AI is a technical analysis pattern recognition system that evaluates trading charts across multiple timeframes. Unlike traditional indicators requiring complex interpretation, our technology processes complete chart contexts to identify high-probability trading setups. The system continuously learns from market movements, improving its accuracy with each analysis and adapting to changing market conditions.

Powered by Massive Market Intelligence
Our AI engine is trained on over 15 million historical chart patterns spanning decades of market data across bull markets, bear markets, and consolidation periods. This massive dataset enables ChartEye to recognize subtle formations like double tops, head and shoulders, and bull flags that typically precede significant price movements. The result is analysis rooted in actual market behavior rather than theoretical models.

How to Use ChartEye AI for Technical Analysis
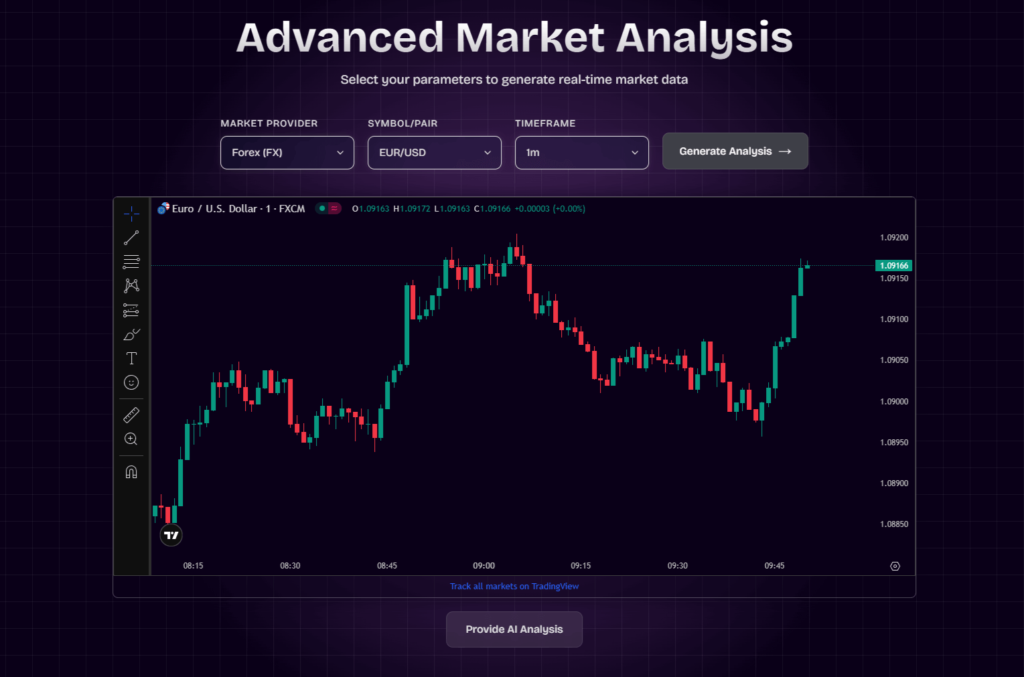
Select your market and timeframe from the dashboard
ChartEye instantly analyzes the chart and displays results
Review highlighted patterns, support/resistance levels, and entry/exit points
Key Features of ChartEye AI
Pattern Recognition
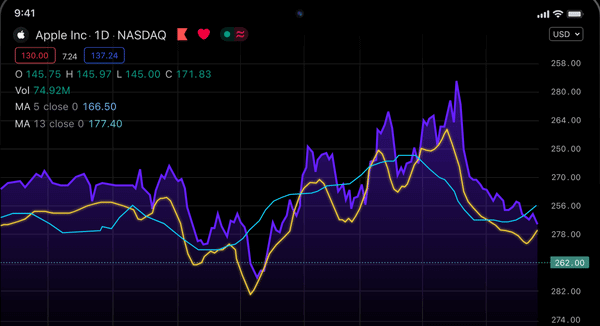
ChartEye automatically detects chart formations like the bullish trend structure (higher highs and higher lows) shown in the EURUSD example
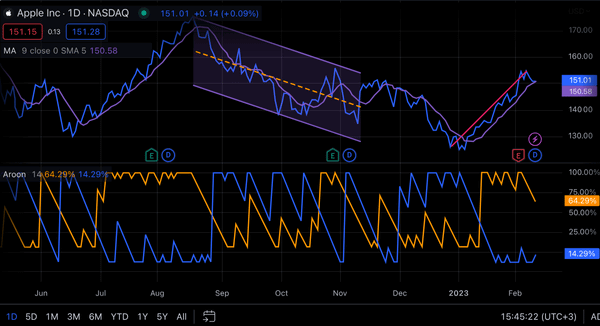
Moving Average Analysis
The system evaluates price in relation to key moving averages (20 and 50-period EMAs) and identifies when they serve as dynamic support/resistance
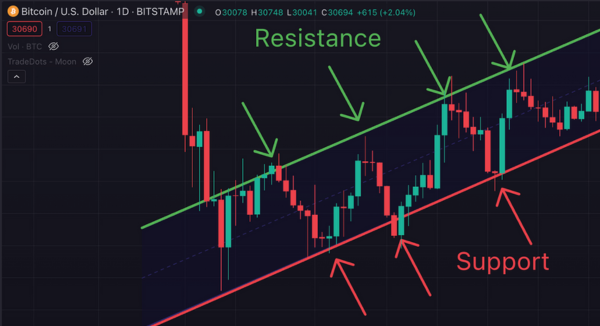
Support/Resistance Detection
ChartEye precisely identifies critical price levels where reversals or breakouts may occur
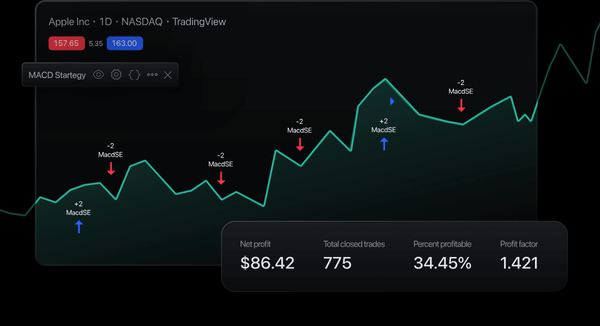
Multi-Indicator Integration
The system analyzes multiple indicators simultaneously (RSI, MACD, Bollinger Bands, Stochastics) to confirm signals and reduce false positives
Entry Point Calculation
ChartEye suggests optimal entry points based on technical confluences, such as retests of support at the 20-period moving averages
Risk Management Parameters
The AI provides specific stop-loss recommendations based on recent swing levels
ChartEye AI vs. Traditional Technical Analysis
| Feature | ChartEye AI | Traditional Technical Analysis |
|---|---|---|
| Analysis Speed | Instant analysis (under 5 seconds) | Hours of manual chart study |
| Pattern Recognition | Identifies 50+ chart patterns automatically | Requires trained eye to spot patterns |
| Multi-Timeframe Analysis | Simultaneously analyzes all timeframes | Must check each timeframe separately |
| Entry/Exit Points | Precise price levels with probabilities | General areas requiring interpretation |
| Indicator Integration | Considers 15+ indicators simultaneously | Typically limited to 3-5 indicators at once |
| Learning Curve | Minimal - results are immediately usable | Months or years to develop proficiency |
| Emotional Bias | Eliminates emotional trading decisions | Susceptible to fear, greed, and confirmation bias |
| Update Frequency | Real-time continuous analysis | Manual updates requiring constant attention |
| Historical Pattern Matching | Compares current patterns with millions of historical examples | Limited by analyst's experience and memory |
| Risk Management | Calculates optimal stop-loss levels based on volatility | Often uses arbitrary or fixed percentage stops |
| Feature | ChartEye AI | Traditional TA |
|---|---|---|
| Speed | Instant | Hours |
| Patterns | Auto 50+ | Manual |
| Timeframes | All Simultaneous | Separate Check |
| Entry/Exit | Precise | General |
| Indicators | 15+ | 3-5 |
| Learning | Minimal | Long |
| Bias | None | High |
| Updates | Real-time | Manual |
| Historical | Extensive | Limited |
| Risk | Calculated | Fixed |
Take Control of Your Trading Decisions
Most Common FAQs
What is ChartEye AI?
ChartEye AI is an advanced technical analysis tool that uses artificial intelligence to identify trading patterns, support/resistance levels, and optimal entry/exit points across financial markets. It analyzes complete chart contexts to recognize complex pattern combinations and their historical reliability, providing traders with actionable insights.
How does ChartEye work?
ChartEye works by analyzing your selected chart using our AI engine trained on 15 million historical patterns. Simply select your market and timeframe, and ChartEye instantly highlights key patterns, calculates support/resistance levels, and suggests specific entry points with stop-loss and take-profit targets based on statistical probability.
How accurate are ChartEye's predictions?
ChartEye’s pattern recognition has demonstrated 76% accuracy in identifying high-probability setups based on historical backtesting. However, no analysis tool can predict markets with 100% certainty. ChartEye focuses on finding statistically advantageous setups rather than guaranteeing specific outcomes.
Which markets and timeframes can ChartEye analyze?
ChartEye works across all financial markets including stocks, cryptocurrencies, forex, and commodities. The system analyzes any timeframe from 1-minute to monthly charts, making it suitable for day traders, swing traders, and long-term investors alike.
How can I get started with ChartEye?
Getting started takes less than 2 minutes. Simply create an account, select your preferred market and timeframe from the dashboard, and ChartEye will instantly analyze your chart. Our intuitive interface displays all key information directly on your chart with detailed explanations of each identified pattern.
Are there any costs associated with using ChartEye?
ChartEye is completely free to use. We believe powerful technical analysis should be accessible to all traders regardless of account size or experience level. You can access all features and analysis capabilities without any subscription fees or hidden costs. Simply create an account and start analyzing your charts immediately.
Which platforms is ChartEye compatible with?
ChartEye is a standalone web application that works in any modern browser without requiring integration with other platforms. You can simply log in to our website to access all features without downloading any software or connecting to external trading platforms. This independent design ensures maximum compatibility and simplicity while maintaining the full power of our AI analysis capabilities.